
Most plants know which suppliers they like and which they complain about. Fewer can show why, in numbers the supplier will accept. Vendor rating turns the purchase records the plant already keeps – receipts, inspection results, delivery dates and rates – into one score per supplier, reviewed every month or quarter. It makes sourcing decisions defensible, gives suppliers a clear target, and replaces “your material is always late” with “you met 80% of the scheduled quantity on time last quarter”. This guide explains a simple scoring method and works through three sample suppliers.
What to measure
- Quality – accepted quantity as a share of quantity received, or its mirror image, incoming PPM. See how PPM is calculated.
- Delivery – the share of the scheduled quantity delivered on or before each schedule date, measured against the schedule line, not just the order. See schedules and ASNs in a supplier portal.
- Price – the supplier’s rate against the lowest comparable rate for the same item in the period.
- Optional factors – responsiveness to complaints, documentation (test certificates, invoices that match), payment-term flexibility. Keep them few and objective.
A simple weighted score
Give each factor a weight that reflects what matters for the item. A common starting point for production material is quality 40%, delivery 40%, price 20%. Score each factor out of 100:
- Quality score = accepted / received x 100.
- Delivery score = scheduled quantity delivered on time / scheduled quantity x 100.
- Price score = lowest rate / this supplier’s rate x 100.
Vendor rating = (quality x 40 + delivery x 40 + price x 20) / 100. Grade the result – for example A at 95 and above, B from 85 to 95, C below 85 – and agree in advance what each grade means for future orders. For a critical safety part, quality may deserve 60% of the weight; for a commodity with many sources, price may deserve more.
Worked example: three suppliers, one quarter
Tejaxo Manufacturing (sample data) buys the same item from three suppliers.
| Vendor | Quality | Delivery | Price | Score | Grade |
|---|---|---|---|---|---|
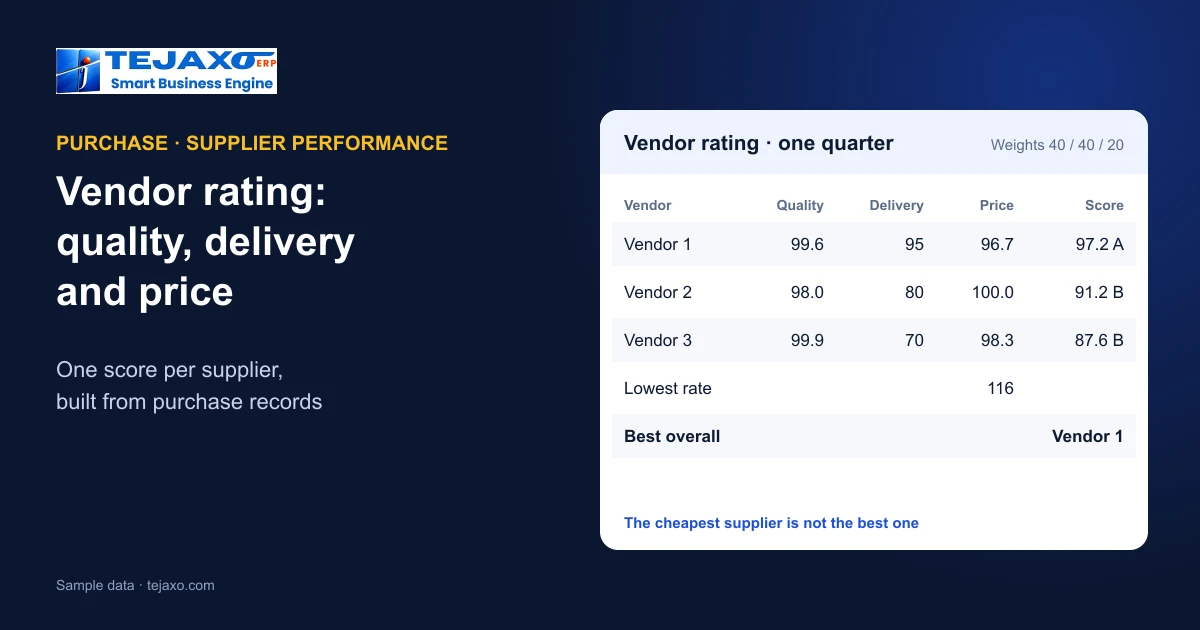
| V 1 | 99.6 | 95 | 96.7 | 97.2 | A |
| V 2 | 98.0 | 80 | 100.0 | 91.2 | B |
| V 3 | 99.9 | 70 | 98.3 | 87.6 | B |
Vendor 1 received 10,000, accepted 9,960 (4,000 PPM), met 95% of the schedule and charged 120 against the lowest rate of 116: score 97.2, grade A. Vendor 2 is the cheapest but rejected 2% (20,000 PPM) and met only 80% of the schedule: 91.2, grade B. Vendor 3 has the best quality (1,000 PPM) but met only 70% of the schedule: 87.6, grade B. The cheapest supplier is not the best one, and the best-quality supplier is the one most likely to stop the line – which a price comparison alone would never show.
Using the rating
- Share it. Send each supplier its score, the three factor scores and the main rejection and delay reasons every quarter. Most suppliers improve once they see the numbers.
- Split the business. Where an item has two or three sources, move volume towards the higher grades.
- Set improvement targets for B and C suppliers – for example halve PPM or reach 90% on-time – with a review date.
- Feed new sourcing decisions. A supplier’s history is the best evidence when a new part is being sourced.
Making the score fair
- Compare like with like. Rate suppliers per item group; a casting supplier and a packaging supplier should not compete on one list.
- Use enough data. A quarter with a handful of receipts can swing wildly; show the number of receipts next to the score.
- Separate the plant’s own faults. If the schedule was changed at short notice or the drawing was wrong, record it so the supplier is not penalised.
- Keep the formula stable. Changing weights every quarter makes trends meaningless.
Rating job-work vendors
Outside processors – plating, heat treatment, machining, painting – deserve a rating too, with slightly different factors. Quality is the share of returned parts accepted; delivery is the turnaround from the returnable gate pass to the return; and a third factor is material accountability – how much of what was sent is returned or accounted for as process loss within the agreed norm. The same gate pass and receipt records that track job work provide the data; see job work software.
Reading the trend, not just the score
A single quarter shows where each supplier stands; four quarters show where it is heading. A B supplier improving every quarter may deserve more business than an A supplier slowly slipping. Chart each supplier’s score with its three factor scores underneath, so a falling total can be traced to quality, delivery or price at a glance, and discuss the trend – not only the latest grade – in the supplier review.
Where the data comes from
No separate spreadsheet is needed if the purchase cycle is recorded properly. The purchase order carries the schedule and the rate; gate entry and the GRN record what arrived and when; incoming inspection records accepted and rejected quantity with a reason; rejected material goes back on a debit note – see from gate entry to debit note; and the purchase voucher is 3-way matched to the order and the receipt – see 3-way match and GRNI. Price trends by item and supplier come from the same orders.
How Tejaxo ERP handles it
Tejaxo ERP runs procure-to-pay from requisition and purchase order with approval and schedules, through gate entry, batch-wise GRN and incoming QC with accept, reject and PPM, to a purchase voucher 3-way matched to the PO and receipt. Purchase reports include vendor rating, price trends, schedule vs actual, the 3-way match, GRNI and purchase TAT. For plants on SAP or Microsoft Dynamics, the same supplier view can be built around the existing ERP through a vendor portal.
Getting started
- Pick the top suppliers – those covering most of the purchase value.
- Agree the weights and grades with purchase, quality and production.
- Check the data: schedules on every PO, a reason on every rejection, receipts dated correctly.
- Run the first quarter internally, correct any data problems, then share the second quarter with suppliers.
Common mistakes
- Rating on price alone. The cheapest rate often costs more in rejections and line stoppages.
- Measuring delivery against the order date only. Schedules spread over weeks need line-wise measurement.
- Subjective scores. “Cooperation: 7 out of 10” invites argument; stick to recorded data.
- Rating without consequences. If grades never affect orders, suppliers stop paying attention.
Next step
See vendor rating, price trends and schedule vs actual on your own suppliers in a free demo.
Frequently asked questions
What is vendor rating?
A periodic score for each supplier, usually built from quality (accepted vs received or PPM), delivery (on-time share of scheduled quantity) and price, weighted by importance.
How is a vendor rating calculated?
Score each factor out of 100, multiply by its weight and add: for example quality x 40% + delivery x 40% + price x 20%. Then grade the result, such as A at 95 and above.
What weights should be used?
A common starting point for production material is quality 40%, delivery 40%, price 20%. Adjust per item group, then keep the weights stable so trends stay comparable.
Should delivery be measured per order or per schedule line?
Per schedule line. An order delivered in full but late or early against its weekly schedule still disrupts production.
How often should vendors be rated?
Monthly for internal review and quarterly for sharing with suppliers is common; show the number of receipts so small samples are not over-read.
Does Tejaxo ERP provide vendor rating?
Yes. Purchase reports include vendor rating, price trends, schedule vs actual, 3-way match, GRNI and purchase TAT, built from POs, GRNs and incoming QC with PPM.