
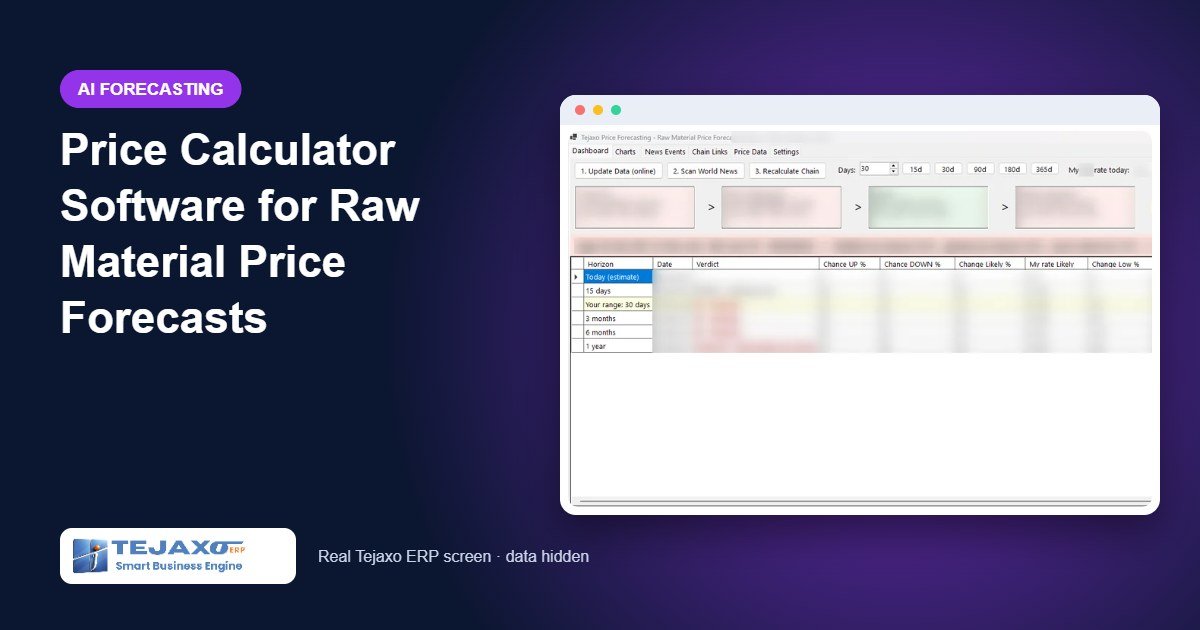
For many manufacturers the biggest unknown in a quotation is not labour or overhead but the raw material. Prices of petrochemical, metal and imported inputs move with crude oil, freight, exchange rates and world events, and a fixed-price quotation given today can turn into a loss three months later. Price calculator software that looks forward, not only at today’s rate, helps estimators and buyers make those decisions with numbers instead of guesswork.
The Tejaxo Price Calculator does exactly this. It forecasts where a raw material price is likely to go over the next few weeks to a year, shows a range rather than a single number, and explains the reasons in plain language. This article explains how it works, what each part of the screen means, and how to use the result in costing, quotations and purchase planning.
The problem: quoting today for material you buy tomorrow
A typical situation in a plant: a customer asks for a six-month price on a component. The estimator takes today’s raw material rate, adds conversion cost and margin, and sends the quotation. If the material rises 10% in that period, the margin on the whole order can disappear. If the buyer had known the risk, the company could have quoted with a price-variation clause, quoted a shorter validity, or booked material in advance.
Most buyers follow the market through calls with dealers and news headlines. What they lack is a structured view: how much of the movement in their material is driven by upstream prices, how quickly those changes pass through, and how wide the realistic range is.
How the Price Calculator works: the price chain
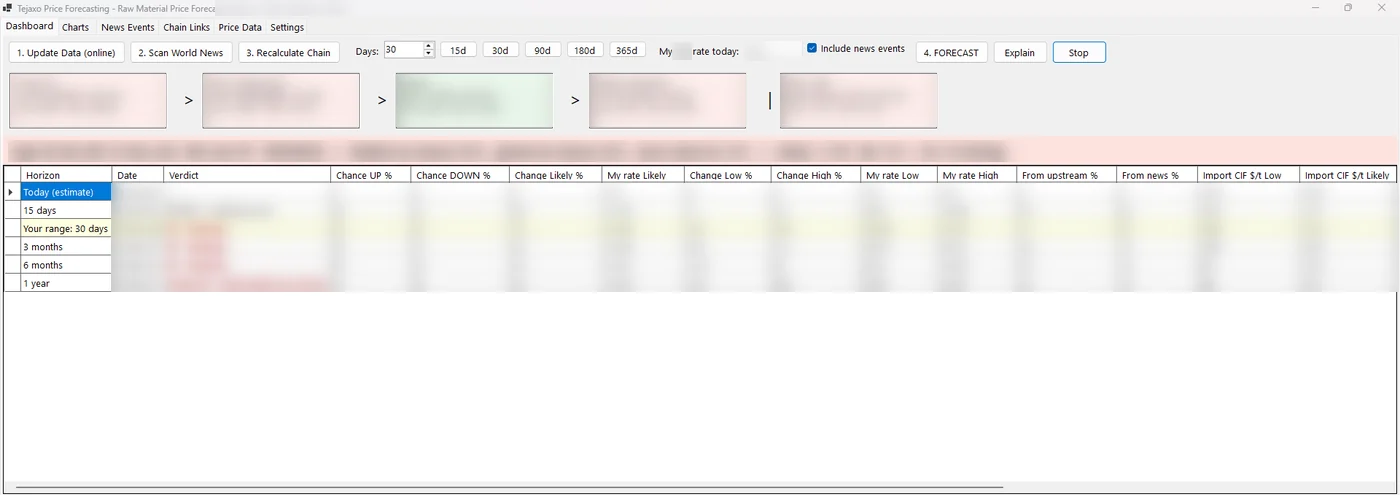
Many raw materials sit at the end of a chain. A petrochemical input, for example, moves with its feedstock, which moves with natural gas, which in turn moves with crude oil. The calculator models such a chain link by link, together with the USD / INR rate for imported materials.
For each link it calculates, from more than three years of monthly price history, three things: how strongly the downstream price responds to the upstream one (elasticity), how many months the effect takes to pass through (lag), and how closely the two have moved together (correlation). The dashboard shows a tile for every link in the chain with its latest price, the month of that price, and the one-month and three-month change.
The four steps on the dashboard
- Update Data (online) – fetches the latest prices for every link of the chain.
- Scan World News – looks for recent world events that can move the chain, such as supply disruptions, freight and conflict risks or changes in demand, and saves them as news events.
- Recalculate Chain – recalculates the elasticity, lag and correlation of every link.
- Forecast – produces the forecast for the chosen horizon, with or without news events.
The horizon is set in days, with quick buttons for 15, 30, 90, 180 and 365 days. You also enter My rate today, your own current purchase rate per kg, so the forecast is translated into your price, not only an international benchmark. Separate tabs hold charts, news events, chain links, price data and settings.
Reading the forecast
The forecast table has one row for each horizon: today’s estimate, your chosen range, one month, three months, six months and one year. For each row it shows:
- Change low, likely and high (%) – the expected movement and its range. Low means there is about a 10% chance of the price going below that level; high means about a 10% chance of going above it.
- From upstream and from news (%) – how much of the expected change comes from the price chain and how much from news events.
- International price in dollars per tonne (low, likely, high) and the rupee price per kg, with the USD / INR rate used.
- My rate low, likely and high – the same forecast applied to the rate you entered.
- Verdict – a verdict such as up or stable for each horizon, with the chance of a rise and the chance of a fall. A headline line summarises the verdict for your chosen range.
The calculator can also show an import CIF price per tonne taken from India’s customs import data. This is the price before customs duty, GST, freight to plant and dealer margin, so it is a reference point and not a local market quote.
The explanation in plain language
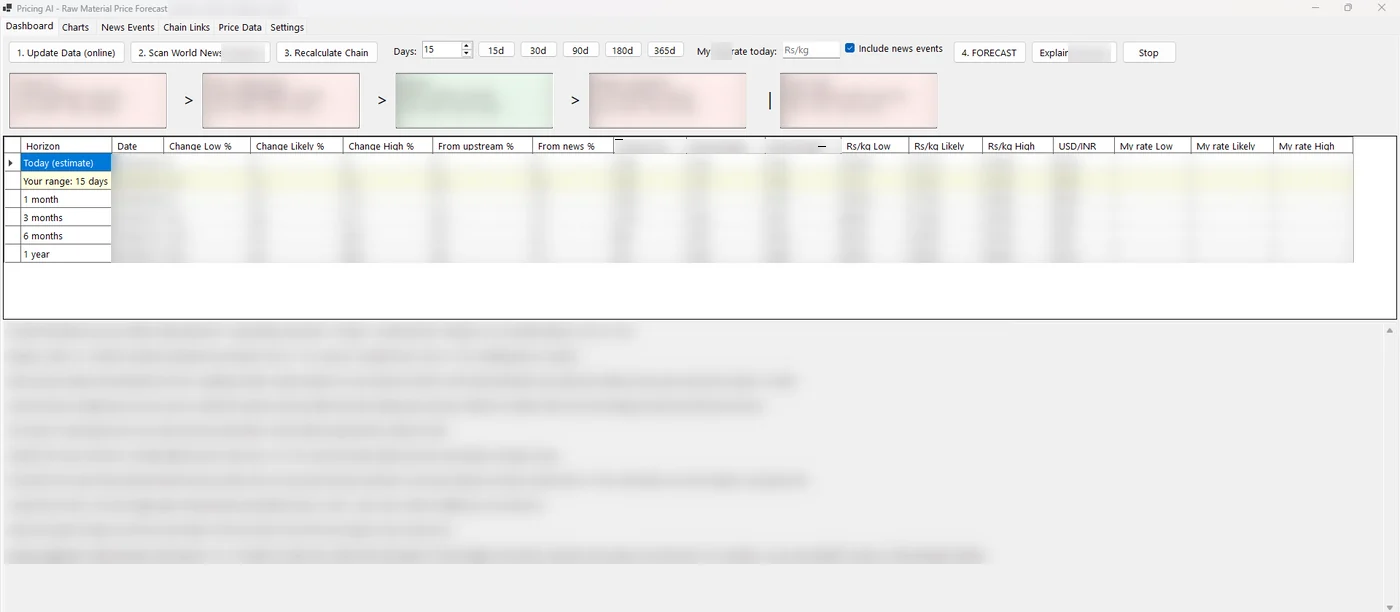
Numbers alone do not help a purchase committee decide. The Explain button writes a short explanation of the forecast: the overall direction, how wide the range is, the main reasons (for example a rise in the feedstock that usually passes through in about a month, or higher freight costs on an import route), the upside and downside risks, and a buying suggestion such as splitting the purchase: booking part of the need now and the rest in instalments. The explanation states clearly that nothing in a forecast is certain.
Worked example: using the range in a quotation
Tejaxo Manufacturing is asked for a three-month fixed price on Product B, a moulded part that uses 2.5 kg of Product A per piece. The buyer’s current rate for Product A is Rs 100 per kg. The calculator’s three-month forecast on that rate, using sample figures, is:
| Scenario (3 months) | Product A rate (Rs/kg) | Material cost per piece (Rs) | Change vs today |
|---|---|---|---|
| Today | 100.00 | 250.00 | – |
| Low | 91.00 | 227.50 | -22.50 |
| Likely | 104.50 | 261.25 | +11.25 |
| High | 120.00 | 300.00 | +50.00 |
On an order of 4,000 pieces, the difference between today’s rate and the likely rate is Rs 45,000 of material cost; the high case adds Rs 2,00,000. With that in front of them, the management can choose one of several sensible options: quote on the likely rate, quote on today’s rate with a raw-material variation clause, shorten the price validity, or book part of the material now as the buying suggestion recommends. Each choice is a business decision, but it is now an informed one.
Common mistakes the calculator helps avoid
- Quoting long validity on today’s rate. The range shows how much risk a fixed price carries.
- Reacting to one headline. The split between upstream and news contribution shows whether a move is backed by the chain or only by news.
- Ignoring the time lag. If a feedstock rise usually reaches your material in a month, there is a window to buy before it does.
- Confusing import prices with local rates. The CIF reference is labelled as excluding duty, GST, freight and margin.
- Buying everything at once. The explanation can suggest staggered purchases when the range is wide.
Who it is for
The Price Calculator is useful for companies whose margins depend on volatile, chain-linked raw materials: chemical and resin users, plastic and rubber processors, packaging converters and other manufacturers buying imported inputs. Buyers use it for timing purchases; estimators and sales teams use it when giving fixed-price quotations. See how Tejaxo works with the chemical industry and the packaging industry.
The forecast is decision support. The quotation itself is prepared in your sales system; for enquiries, quotations and sales orders, see Tejaxo CRM and Tejaxo ERP. The calculator stores its data in a Microsoft SQL Server database.
How Tejaxo implements this
We start with a discovery session to identify the raw materials that matter most to your costs and the price chain behind each one. We then run a pilot on your own materials and purchase rates, so your buyers can compare the forecast ranges with the market as it moves. After go-live and training for the purchase and costing teams, the same Tejaxo team supports you.
See the forecast for your raw material
If raw material movements regularly eat into your quoted margins, a forward-looking price range is a practical tool for both buyers and estimators. Book a free demo or message us on WhatsApp at +91 96717 27474, and tell us which material you would like to see.
Frequently asked questions
What does the Tejaxo Price Calculator do?
It forecasts the likely price of a raw material over horizons from a few days to a year. It follows the upstream price chain and the USD / INR rate, can include world news events, and shows low, likely and high values in dollars per tonne and rupees per kg, with a plain-language explanation.
What do low, likely and high mean in the forecast?
Low is the level with about a 10% chance of the price going below it, and high is the level with about a 10% chance of going above it. Likely is the central estimate. The width of the range shows how uncertain the outlook is.
Is the forecast a guaranteed price?
No. It is an estimate based on price history, the upstream chain and news, and the tool states that nothing in it is certain. Use it as an input to purchase timing and quotation decisions, not as a supplier quote.
Can I see the forecast in terms of my own purchase rate?
Yes. Enter your current rate per kg, and the forecast shows your own rate as low, likely and high for each horizon.
What is the import CIF price shown in the tool?
It is the import price reported in India’s customs data, before customs duty, GST, freight to plant and dealer margin. It is a reference point, not a local market quote.
Is the Price Calculator available to buy?
Yes, it is a Tejaxo product available for purchase. Contact Tejaxo to discuss the raw materials and price chain that matter to your business.