
A store with a few thousand items cannot watch every item with the same care. Counting everything every month is impossible, and counting everything once a year means mistakes run for eleven months. ABC analysis sorts items by how much money they tie up; FSN analysis sorts them by how often they move. Together they tell the store which items to count often, which to reorder carefully and which are quietly turning into dead stock. This guide explains both, works through a sample store and shows how they drive cycle counting.
ABC analysis: by consumption value
For each item, multiply the annual consumption quantity by its rate to get the annual consumption value. Sort items from highest to lowest value and add a cumulative percentage. A common split is:
- A items: the few items that make up roughly the first 70% of value.
- B items: the next 20%.
- C items: the many items that make up the last 10%.
The cut-offs are a convention, not a law – some plants use 80 / 15 / 5. What matters is applying the same rule every time so the classes mean something.
FSN analysis: by movement
FSN groups items by how often they are issued. A simple rule is to count the months in the last year in which the item had at least one issue:
- F – fast moving: issued in 9 or more months.
- S – slow moving: issued in 1 to 8 months.
- N – non-moving: no issue in 12 months.
Plants also use issue quantity relative to stock, or the days since the last issue; the stock ageing report shows the same picture by age bucket.
Worked example: eight items
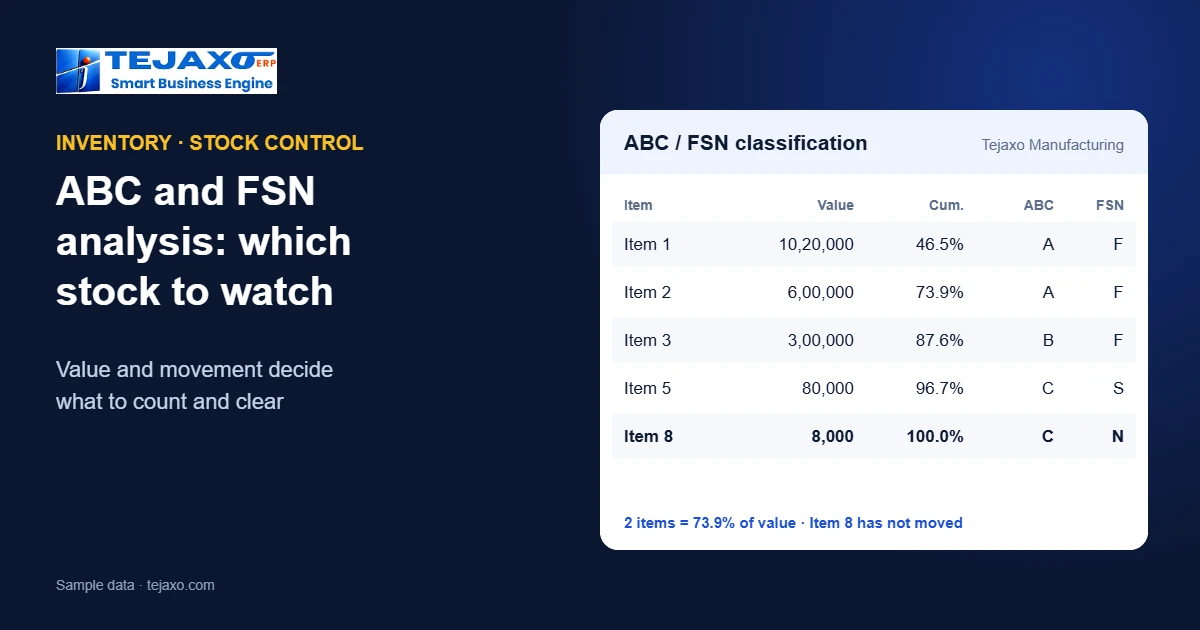
Tejaxo Manufacturing (sample data) classifies eight items. Total annual consumption value is 21,93,000.
| Item | Qty / yr | Rate | Value | Cum. | ABC | FSN |
|---|---|---|---|---|---|---|
| Item 1 | 1,200 | 850 | 10,20,000 | 46.5% | A | F |
| Item 2 | 300 | 2,000 | 6,00,000 | 73.9% | A | F |
| Item 3 | 5,000 | 60 | 3,00,000 | 87.6% | B | F |
| Item 4 | 800 | 150 | 1,20,000 | 93.0% | B | F |
| Item 5 | 2,000 | 40 | 80,000 | 96.7% | C | S |
| Item 6 | 150 | 300 | 45,000 | 98.7% | C | S |
| Item 7 | 400 | 50 | 20,000 | 99.6% | C | S |
| Item 8 | 100 | 80 | 8,000 | 100.0% | C | N |
Two items – 25% of the list – carry 73.9% of the value and are class A. Two more are B (19.2%), and the remaining four are C with only 7.0% of the value. Item 3 shows why the two analyses are needed together: it is the most-issued item by quantity but only a B by value. Item 8 is a C item that has not moved in a year – an N – so its stock is a write-off waiting to happen and a candidate for return, use elsewhere or disposal.
Running the analysis step by step
- Take twelve months of issues from the stock ledger – consumption to production and sales, not transfers between stores.
- Value them at a consistent rate, such as the current weighted average, so price changes during the year do not distort the ranking.
- Sort by value and mark the cut-offs for A, B and C.
- Count the months with issues for FSN, and list items with stock but no issue at all.
- Share the list with stores, purchase and planning, and agree the counting and reorder rules for each class.
What to do with each class
- A items: tight reorder levels reviewed often, small frequent orders, monthly cycle counts, and a named person responsible for each item.
- B items: standard reorder levels, quarterly counts.
- C items: simple min-max rules, larger less frequent orders, a count once or twice a year.
- F items: keep near the issue counter in fixed bins; check that the reorder level keeps up with usage.
- S items: review whether the stock level is still justified.
- N items: list them every quarter and decide – use, return, sell or write off – before they age further.
The ABC-FSN matrix
Crossing the two gives nine groups. Two need the most attention: A-F items, which are valuable and move fast, so a stock-out stops production and an error costs real money; and A-N or B-N items, where significant money is sitting on the shelf without moving. C-F items are cheap but frequent – make them easy to pick and never let them run out. C-N items are small individually but add up across hundreds of items; clear them in one exercise rather than one by one.
Cycle counting instead of a year-end stock-take
A cycle count verifies a few items every day or week instead of closing the store once a year to count everything. ABC sets the frequency. In the sample store, counting A items monthly, B quarterly and C twice a year means about 40 item counts a year for eight items – spread across the calendar, with the valuable items checked twelve times. Each count compares physical quantity with system stock by bin; differences are investigated while the cause is still fresh – an unrecorded issue, a receipt in the wrong bin, a wrong unit of measure – and corrected with an approved adjustment.
How Tejaxo ERP handles it
Tejaxo ERP reports stock ageing, ABC and FSN analysis and re-order levels from the stock ledger, keeps stock by bin location and supports physical verification, with valuation by FIFO, LIFO, weighted average or standard – see inventory management and warehouse management. Barcode and QR scanning make counting by bin faster and catch wrong-bin stock at the shelf; for batch items, see FIFO vs FEFO picking.
Setting reorder levels by class
Once items are classed, reorder levels can be set with the care each class deserves. For A items, work out safety stock and the reorder point from actual daily usage and lead times, and review them every month – the free reorder point and EOQ calculator does the arithmetic. For C items a simple min-max is enough. Value the stock consistently while you do it; the stock valuation calculator shows how FIFO and weighted average change the figures.
Common mistakes
- Classifying once and never again. Usage and rates change; re-run ABC and FSN every quarter.
- Using quantity instead of value for ABC. The most-issued item is not necessarily the most valuable.
- Ignoring N items because they are C. Hundreds of small non-moving items add up to real money and shelf space.
- Counting without investigating. A cycle count that only overwrites the system quantity hides the process error that caused the difference.
Next step
See ABC, FSN, stock ageing and bin-wise physical verification on your own item list in a free demo.
Frequently asked questions
What is ABC analysis in inventory?
Classifying items by annual consumption value (quantity x rate): A items are the few that make up about 70% of value, B the next 20% and C the many items in the last 10%.
What is FSN analysis?
Classifying items by movement: F (fast moving), S (slow moving) and N (non-moving). A simple rule counts the months in the last year in which the item was issued.
Why use ABC and FSN together?
ABC shows where money is tied up; FSN shows what is moving. Together they show which items to control tightly, which to keep easy to pick and which are becoming dead stock.
How often should A, B and C items be counted?
A common practice is A items monthly, B items quarterly and C items once or twice a year, spread across the year as cycle counts.
What is a cycle count?
Verifying a few items at a time against system stock, every day or week, instead of one annual stock-take – so differences are found and explained while the cause is still fresh.
Does Tejaxo ERP provide ABC and FSN reports?
Yes. Stock ageing, ABC and FSN analysis, re-order levels, bin locations and physical verification are standard in Tejaxo ERP inventory.