

What Is FSN Analysis?
FSN analysis is an inventory classification method that groups items into Fast-moving, Slow-moving and Non-moving based on how frequently they are issued or consumed. It tells stores, purchase and finance teams which items deserve tight control, which need a lower reorder quantity, and which are tying up working capital without being used.
For an Indian manufacturer, this matters because stock is often the largest asset on the balance sheet after plant and machinery. A plant that does not know which items have stopped moving ends up buying more of what it already has, filling racks with dead stock and carrying avoidable interest cost. FSN gives a simple, repeatable answer to the question every owner asks: what in my stores is actually being used?
FSN Full Form and the Three Classes
FSN stands for Fast, Slow and Non-moving. Each class describes consumption behaviour, not value or importance.
| Class | Meaning | Typical rule (adjustable) | Usual stance |
|---|---|---|---|
| F: Fast-moving | Issued frequently and regularly | Last issue within about 90 days | Keep availability high, review reorder level often |
| S: Slow-moving | Issued occasionally | Last issue between about 91 and 180 days | Reduce order quantity, buy closer to need |
| N: Non-moving | No meaningful issue for a long period | No issue for more than about 180 days | Investigate, then sell, return, rework or write down |
The day limits above are common starting points, not a legal standard. Each company should set its own limits by item group. A packing carton and a die for a special product do not behave alike, so one limit for the whole plant is rarely right.
How to Classify Items: Two Common Methods
Method 1: Days since last issue
Take the date of the last issue (consumption to production, sale or transfer) for each item and compare it with the analysis date. Items fall into F, S or N by the day limits you have chosen. This is the easiest method and works well for spare parts and components with irregular demand.
Method 2: Issue ratio (consumption rate)
Divide the issues in a period by the average or closing stock of the same item, in quantity or in value. A high ratio means the item turns over quickly. A ratio close to zero means the stock is barely being consumed. Many plants use both methods together: the issue ratio shows the pace of consumption and the days since last issue shows how stale the stock has become.
For the related reorder maths, see our guide on reorder level, safety stock and EOQ.
Worked Example: A Sample Stock List
Here is a small, fully invented stock list for Tejaxo Manufacturing, analysed as on 31 March. Issue ratio is the issues of the last 12 months divided by the closing stock value. Rules used: F = last issue within 90 days, S = 91 to 180 days, N = more than 180 days.
| Item | Closing stock (₹) | Issues in 12 months (₹) | Issue ratio | Days since last issue | Class |
|---|---|---|---|---|---|
| RM-01 Steel bar | 4,00,000 | 36,00,000 | 9.0 | 3 | F |
| RM-02 Packing carton | 60,000 | 6,00,000 | 10.0 | 5 | F |
| CP-03 Hydraulic seal | 90,000 | 1,80,000 | 2.0 | 62 | F |
| CP-04 Fastener set | 50,000 | 75,000 | 1.5 | 85 | F |
| RM-05 Special alloy rod | 2,50,000 | 1,00,000 | 0.4 | 120 | S |
| CP-06 Gasket Type B | 40,000 | 20,000 | 0.5 | 150 | S |
| SP-07 Motor bearing (critical spare) | 1,10,000 | 22,000 | 0.2 | 175 | S |
| RM-08 Old-grade resin | 3,00,000 | 30,000 | 0.1 | 210 | N |
| FG-09 Product A, discontinued variant | 1,80,000 | 0 | 0.0 | 400 | N |
| SP-10 Spare for retired machine | 70,000 | 0 | 0.0 | 560 | N |
Now summarise the result by class:
| Class | Items | Stock value (₹) | Share of total |
|---|---|---|---|
| Fast | 4 | 6,00,000 | about 39% |
| Slow | 3 | 4,00,000 | about 26% |
| Non-moving | 3 | 5,50,000 | about 35% |
| Total | 10 | 15,50,000 | 100% |
What the example tells us
- Over a third of the money is idle. Non-moving items hold about 35% of stock value, although they make up only three of ten lines.
- One item needs a closer look. The old-grade resin had some issues during the year, but nothing for 210 days. The days-since-last-issue rule correctly flags it, which a ratio alone could miss.
- The critical spare must not be treated like dead stock. The motor bearing is slow, but if it is stopped, a production line stops. FSN alone cannot show that, which is why it is paired with VED analysis below.
- Fast items still deserve review. The fastener set is fast but its ratio is low, so the stock may be higher than needed.
This is invented sample data to show the method. Your own limits and values will differ.
FSN vs ABC vs VED: Which One to Use?
FSN answers how often an item moves. ABC answers how much money it represents. VED answers how critical it is to operations. Each gives a different view, and the best decisions combine them.
| Analysis | Basis | Question it answers |
|---|---|---|
| FSN | Movement or consumption rate | Is this stock being used? |
| ABC | Annual consumption value | Where is the money? |
| VED | Criticality (Vital, Essential, Desirable) | What happens if we run out? |
Example rules from combining them: a high-value, non-moving, desirable item is a priority for liquidation. A low-value, slow-moving, vital spare is kept on the shelf deliberately. For a deeper look at how ABC and FSN work together with cycle counting, read our article on ABC and FSN analysis for inventory cycle count.
What to Do With Fast, Slow and Non-Moving Stock
Fast-moving items
- Set and review reorder level and safety stock regularly.
- Agree supplier schedules or rate contracts to avoid stock-outs.
- Use barcode or QR tracking so issues are recorded the moment they happen. See barcode inventory software for factories.
Slow-moving items
- Cut order quantities and buy nearer to actual need.
- Check whether a design or customer change has reduced demand.
- Look for substitute use in other products before buying again.
Non-moving items
- Confirm the item is truly unused: check for seasonal demand, pending orders and critical-spare status first.
- Return to the vendor, sell to a buyer, rework into another product, or send for scrap.
- If it cannot be recovered at cost, discuss a write-down or provision with your finance team and auditor.
- Stop further purchase by blocking the item or lowering its reorder level to zero.
FSN Analysis and Indian Accounting Practice
FSN is a management tool, not a statutory report, but its output feeds into several finance decisions.
- Valuation: Indian accounting standards on inventory require stock to be carried at the lower of cost and net realisable value. A non-moving list is the natural starting point for deciding which items may need a write-down or provision.
- Audit and bank reporting: auditors and lenders look at the quality of stock. A clean, dated list of slow and non-moving items supports a better conversation than an unexplained total.
- GST on write-offs: writing off or disposing of stock can have input tax credit consequences. Confirm the current position with your tax advisor before you scrap or write off material.
Exact accounting treatment and thresholds depend on your company, auditor and current rules, so treat this section as a pointer and not as advice. For valuation basics, see our note on stock valuation methods: FIFO, weighted average and standard cost.
Running FSN Analysis in Your ERP Inventory Module
In Excel, FSN needs a clean stock ledger export, a last-issue-date column and a lot of manual care. It works for a single store, but it gets stale quickly and each plant tends to build its own version. In an ERP, the movement history already exists, so the analysis becomes a regular report instead of a month-end project.
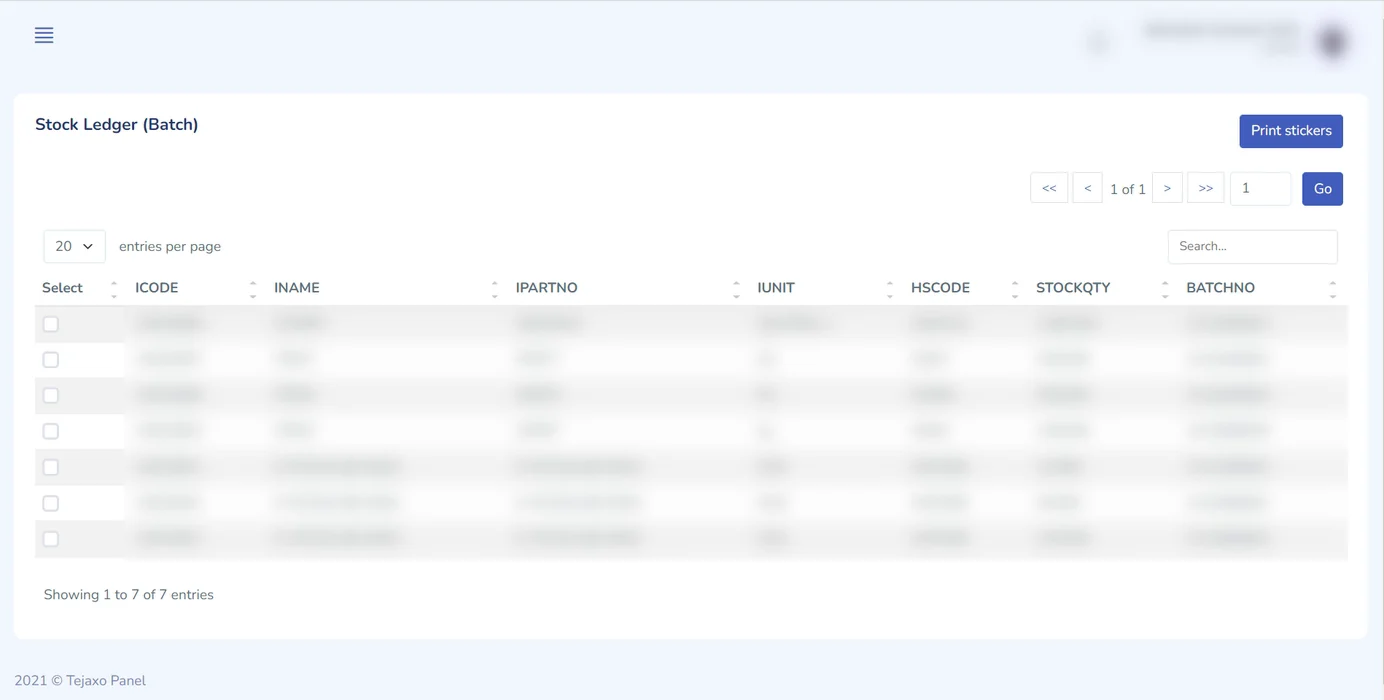
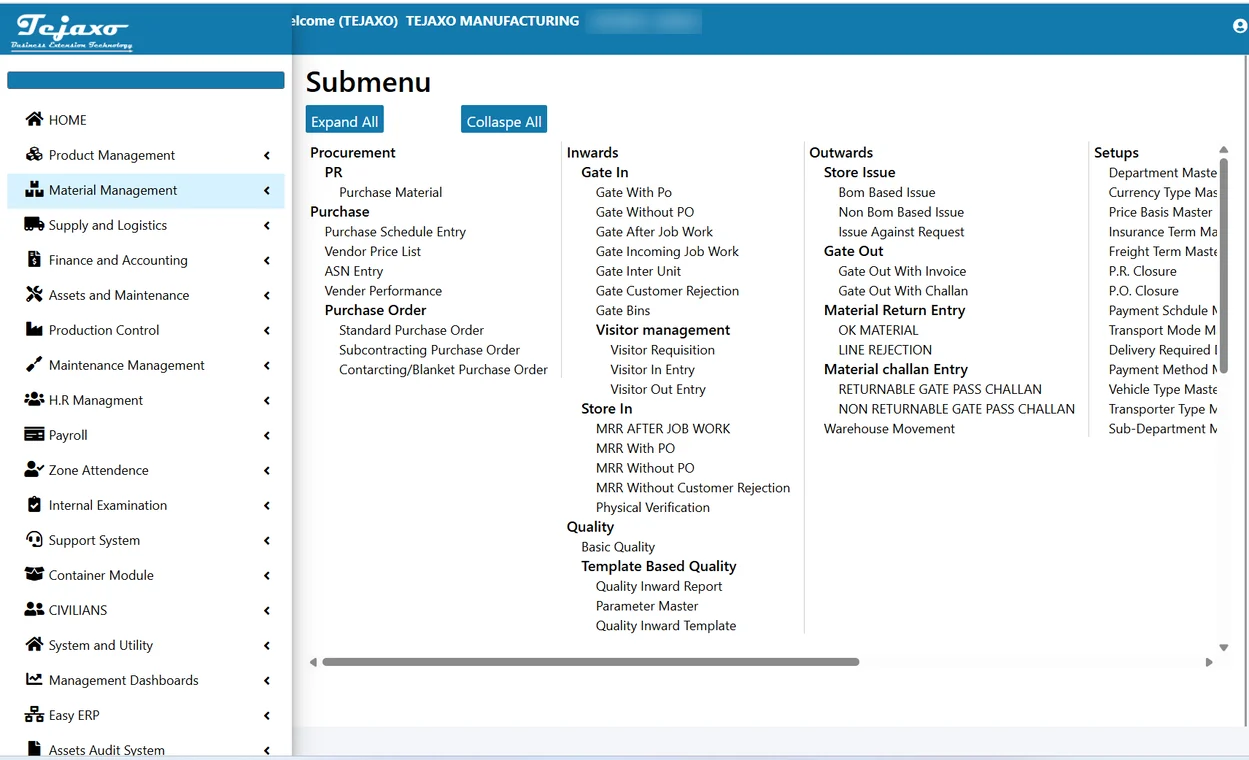
A practical setup looks like this:
- Fix item master data. Item groups, units, reorder level and minimum and maximum stock should be set, so that classification can be done by group.
- Make sure every issue is recorded. If store issues, production consumption and transfers are posted on time, the last-issue date can be trusted.
- Define your day limits per item group. Raw material, consumables, spares and finished goods usually need different limits.
- Run the movement and ageing view on a schedule, for example monthly, and tag each item F, S or N.
- Add criticality. Mark vital spares so they are reviewed rather than disposed of.
- Assign an owner and an action date for every non-moving line.
Tejaxo ERP keeps Inventory and Stores on the same live database as purchase, gate entry, production, quality and finance, so a stock line can be followed from receipt to issue without re-keying. Where batches matter, a batch-wise stock ledger shows what is still on hand and how long it has been there. You can read more on our inventory management software for manufacturing page.
Common Mistakes in FSN Analysis
- Using one day limit for everything. A spare part and a fast-selling consumable cannot share the same rule.
- Ignoring seasonal items. An item bought for a festival or a seasonal order may look non-moving for months and still be correct stock.
- Scrapping critical spares. Always check criticality before disposal.
- Relying on stale master data. Wrong units, duplicate items or missing issue entries distort the result.
- Running it once and forgetting it. FSN is useful only when repeated, so that items migrating from fast to slow are seen early.
- Analysing without action. A report with no owner and no deadline does not release any cash.
Next Step: Make FSN a Routine Report
FSN analysis is simple in concept. The difficulty is having reliable consumption data and a habit of acting on it. If your stores still depend on spreadsheets and month-end clean-ups, it may be time to look at how your ERP records movement. Our guide on ERP vs Excel for manufacturing explains the trade-offs.
If you would like to see how stock movement, batch ledgers and reports work together in Tejaxo ERP, book a free consultation and we will walk through your own stock situation.
Frequently asked questions
What is the full form of FSN analysis?
FSN stands for Fast-moving, Slow-moving and Non-moving. It is an inventory classification technique that groups items by how often they are issued or consumed. Stores, purchase and finance teams use it to decide reorder policy, reduce idle stock and identify items that may need disposal or a write-down.
How do you calculate FSN analysis?
Take the last issue date of each item and count the days up to your analysis date. Items issued within your fast limit are F, those in the middle band are S, and those beyond your non-moving limit are N. You can also divide issues in a period by stock to get an issue ratio.
What are the usual time limits for fast, slow and non-moving items?
A common starting point is up to 90 days since last issue for fast, 91 to 180 days for slow, and over 180 days for non-moving. These are not fixed rules. Each company should set limits by item group, because spares, raw materials and finished goods move at very different speeds.
What is the difference between FSN and ABC analysis?
FSN classifies items by how frequently they move, while ABC classifies them by annual consumption value. FSN shows whether stock is being used, and ABC shows where the money is concentrated. Using both together highlights high-value items that are not moving, which are the best candidates for action.
What should be done with non-moving stock?
First check whether the item is a critical spare, a seasonal item or tied to a pending order. If not, try returning it to the vendor, selling it, reworking it into another product or sending it for scrap. If it cannot be recovered at cost, discuss a write-down with your finance team.
Can an ERP do FSN analysis automatically?
Yes, if the ERP records every receipt and issue with dates, the movement history needed for FSN already exists. The report can then be run on a schedule by item group and warehouse. The accuracy still depends on timely issue entries and clean item master data.